Categories
Augmented Reality Business Strategy

The Top Mobile AR Regions in 2012

Due to a variety of factors, including the fact that the two biggest manufacturers are not publishing these figures, no one knows precisely how many smartphones shipped in 2011. Smartphone shipments are just part of the data which would be useful to guide where mobile AR efforts could have the highest impact in 2012.

Let's assume that only iOS and Android users could have mobile AR experiences. Those who have smartphones need to know how to use them and see some benefits as regular users. Running apps at least once a month is a strong qualification. Take a look at the figure released by Flurry on December 23, 2011 (below) at the current total addressable market (TAM) for iOS and Android apps.

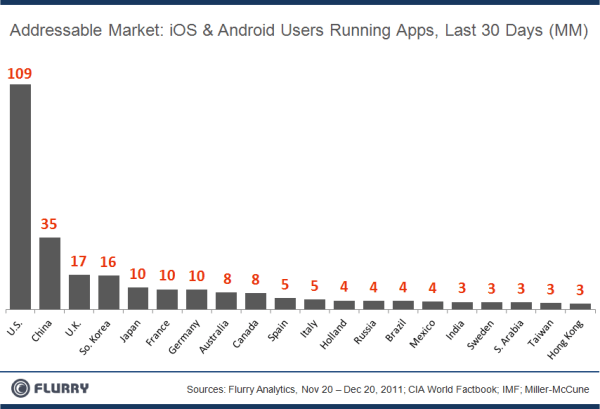
The largest chunk of the world’s active installed base is in the US, with 109 million out of 264 million, or 41%. But, the US is not the geography in which we have the greatest number of AR experiences available (experiences are more heavily concentrated in Western Europe). And, considering the conditions put on providers of geospatial information and the nascent state of that market, smartphone users in the next largest market, China, are unlikely to have a proliferation of AR experiences in 2012.

Now, look at the other Top 10 addressable markets in the second figure (below).

In addition to boosting the opportunities to engage users in the US, developers of mobile AR should be seriously expanding their AR publishing reach into Japan, Germany, France, UK and Italy.

Categories
Innovation Research & Development

Innovation Research

INSEAD has published its Global Innovation Index for 2011.

"The overall GII scores provide a composite picture of the state of each country’s innovation performance. The Report stresses leaders by index, by income group and by region.

"Switzerland comes in at top place in the overall GII 2011 rankings (up from position 4th last year) on the basis of its strong position in both the Input and Output Sub- Indices (3rd and 2nd, respectively). Although the country does not top any individual pillar, it places within the top 5 in three Input pillars (Institutions, Market and Business sophistication) and both Output pillars (Scientific outputs and Creative outputs)."

Source: INSEAD (2011) Global Innovation Index

Another interesting point to examine is where China is positioned on the scales of R&D users and R&D importers. From the LiftLab, this is part of a post by Marc Laperrouza on his "Time to look east" blog. Marc pulled out this chart and made the comment below.

"As with many synthetic indexes, it is always worthwhile to dig further into the data. It turns out that China has a number of strengths and weaknesses. Among the former, the report lists patent applications, gross capital formation, high-tech imports and exports (a large majority are MNC-driven).

Among the latter, one can find regulatory quality, press freedom and time to start a business. True enough, both business and market sophistication have notably increased over the years and so has scientific output.If China aims to reach the top 20 or higher it will have to work hard (and fast) on its institutions."